Self-service is live, customers are using the initial processes, and data is appearing in the dashboard. This is where the actual success measurement begins.
The number of app launches or started processes is not enough. For internet service providers, what happens next is crucial: Is an issue resolved? Where do customers drop off? When is personal support required? And do customers contact you again after a supposedly successful process?
Self-service success is therefore best measured along the entire service journey.
Quick answer: How can self-service success be measured?
For a reliable assessment, internet service providers should combine several self-service KPIs:
- Usage and started processes
- Completion and resolution rate
- Drop-off rate
- Handovers to personal support
- Repeat contacts
- Processing time after a handover
- Customer Effort
A single metric only ever answers part of the question. Only by combining these values can you see whether a digital service process is actually working in day-to-day operations.
Why is the usage count not enough after go-live?
Increasing usage is initially a positive sign: customers are finding and using the digital offering. However, it says little about the quality of the process.
For example, 10,000 initiated diagnostic processes might look more successful at first glance than 5,000. However, if many users drop out during the diagnosis or contact the hotline anyway, there is hardly any reduction in workload.
The same applies to declining support contacts. These, too, should be viewed in the context of solution quality and repeat contacts.
The central question is therefore: What happens to an inquiry from the moment it enters the self-service portal until it is actually resolved?
The article Technical customer service for internet providers: What really helps customers provides a more detailed analysis of this service journey. It becomes clear there that completion rate, resolution rate, handovers, repeat contacts, and processing time should be considered together.
Which self-service KPIs are relevant after go-live?
1. Usage: Are the digital processes being adopted?
The starting point is the question of whether customers are actually using the process provided. Suitable metrics include, for example:
- Number of processes started
- Usage rate
- Usage per service request
- Usage per customer group or time period
These values show the adoption of the self-service. However, they only represent the starting point for measuring success.
A process can be used frequently and still achieve a poor resolution rate.
2. Completion and resolution rate: Do customers actually reach their goal?
The completion rate shows how many started processes are completed through to a defined end. A distinction should be made between this and the actual self-service resolution rate.
Simply put: Self-service resolution rate = successfully resolved requests / relevant requests started
A clear definition of "resolved" is important. A process that has been clicked through to the end is not proof that the original problem has been eliminated. Depending on the use case, technical test results, user feedback, or the absence of a follow-up contact can provide additional indicators.
This is why First Contact Resolution does not look at speed alone. The metric asks whether a request was actually resolved during the very first contact. The MyProvider expertise on First Contact Resolution provides a more detailed breakdown of this logic.
3. Abandonment rate: Where are users dropping off in the process?
The abandonment rate shows how many customers fail to complete a process they have started. It is particularly valuable when analyzed at the level of individual process steps.
If, for example, many customers drop off at the same diagnostic question, this can point to various causes:
- unclear wording
- missing information
- technical issues
- steps that are too complex
- lack of relevance in the proposed solution
This makes the abandonment rate a concrete basis for optimization.
4. Handoff rate: When is personal support needed?
Not every technical issue can be solved entirely digitally. Therefore, a handoff to support is not automatically a failure.
The crucial factor is whether the existing context is preserved. Support should be able to identify:
- what the symptom is
- which checks have already been performed
- what the results are
- which solution attempts have been made
- at what point the self-service ended
The article Connecting self-service and customer support: How to succeed with handoffs in technical support shows in detail how this handover can be structured and evaluated using metrics such as repeat contacts, processing time, or First Contact Resolution.
The interaction between systems is also relevant here. We show how self-service, CRM, and ticketing systems take on different roles in the article How internet providers can manage support processes: Self-service, CRM, and ticketing.
5. Repeat contacts: Was the issue really resolved?
Repeat contacts are among the most important control metrics for resolution quality. If a customer gets in touch again shortly after with the same issue, the previous process may have been formally closed, but was not practically successful.
Therefore, internet providers should check:
- How frequently do follow-up contacts occur regarding the same issue?
- Through which channel do they occur?
- How much time passes between self-service and renewed contact?
- Which processes cause a particularly high number of repeat contacts?
Especially with a high completion rate, repeat contacts can show whether this rate realistically reflects actual success.

6. Processing time after handover: Is the pre-qualification effective?
Even when self-service cannot fully resolve an issue, it can still improve the subsequent handling process. If technical information and completed diagnostic steps are already available, the support team can step in more effectively. A suitable metric for this is the Average Handling Time or the processing time after the handoff.
AHT = (Talk time + hold or wrap-up time) / Number of contacts
The specific components a company includes can vary. Therefore, a consistent definition throughout the entire measurement period is essential. The MyProvider expertise on Average Handling Time explains the calculation and application of this metric in greater detail. However, a decreasing processing time alone is not a sufficient indicator of success. If the number of repeat contacts increases at the same time, the process may have simply been handled faster rather than better.
7. Customer Effort: How easy was the process from the customer's perspective?
Operational metrics show what is happening within the system. However, they do not fully explain how customers perceive the process.
This is where the Customer Effort Score complements the analysis. It measures how easy or difficult customers find it to resolve their issues. Qualtrics describes the CES as a metric for the perceived effort involved in an interaction or problem-solving process.
Measuring this is particularly useful immediately after a relevant service process, for example after:
- Setup
- Wi-Fi diagnostics
- Technical troubleshooting
- Contact with support
More information on classification and measurement can be found in the MyProvider expertise on the Customer Effort Score.
How can these KPIs be interpreted together?
The real self-service analysis begins where multiple metrics are brought together.
Example 1: High usage + high abandonment rate
The process is found and started, but friction occurs somewhere along the journey.
The next step is therefore not to promote self-service further, but to analyze the drop-off points.
Example 2: High handover rate + decreasing handling time
Many issues still require personal support. At the same time, digital pre-qualification can help support staff get to the root cause faster.
The handover rate alone would not reveal this effect.
Example 3: High resolution rate + many repeat contacts
The digital process is formally completed successfully, yet customers still require further assistance afterward.
In this case, you should check whether the definition of a "resolved" case is being applied too early.
These examples show that good self-service performance is the result of the interplay between several key metrics.
How do you create a reliable baseline for comparison?
After going live, measurement requires a baseline. To establish this, key metrics should be documented for a defined initial period, for example:
- Number of relevant support requests
- Self-service usage
- Resolution rate
- Drop-off rate
- Handover rate
- Repeat contacts
- Handling time
Subsequently, changes can be compared following product or process adjustments. External factors should be taken into account here. For example, a major network outage can significantly alter usage, support contacts, and handling times in the short term. The same applies to migrations, hardware changes, seasonal effects, or new communication campaigns.
Therefore, it is less important to look at an isolated before-and-after value than at a traceable trend over comparable periods.
Example: How does a Wi-Fi self-service change after optimization?
An internet service provider analyzes a digital process for Wi-Fi optimization. It turns out that many customers drop off at a specific point. The step is revised and made easier to understand.
These figures are a simplified calculation example. What matters is the trend across several key performance indicators: usage increases, while at the same time the resolution rate improves. Fewer customers drop off, and fewer require follow-up support. Only this combination provides reliable evidence that the adjustment is having an impact.
From reporting to continuous optimization
Self-service measurement should not end with regular reporting after go-live. The key figures can be incorporated directly into the further development of processes:
- Identify notable KPIs
- analyze the affected process or step
- narrow down the cause
- implement targeted changes
- check development against the baseline
This creates a continuous improvement process. This approach is particularly helpful when self-service data is linked with information from CRM, ticketing, and personal support. Only then is it possible to track whether an issue that started digitally reappears later on another channel.
Distinguishing between self-service success and profitability
Operational impact and economic benefit are related, but they answer different questions. This article focuses primarily on: Are the digital service processes working?
For the business case, additional metrics come into play:
- Cost per support case
- Contact volume
- Average Handling Time
- Staff capacity
- potentially avoidable contacts
How these key figures interact economically is explained in the article Calculating customer service costs: Why a support case costs more than just the talk time. For an individual scenario analysis, you can then use the ROI calculator can be used.
This keeps the distinction clear:
- Self-service KPIs measure operational effectiveness.
- The business case translates this effectiveness into economic impact.
What role does a dashboard play?
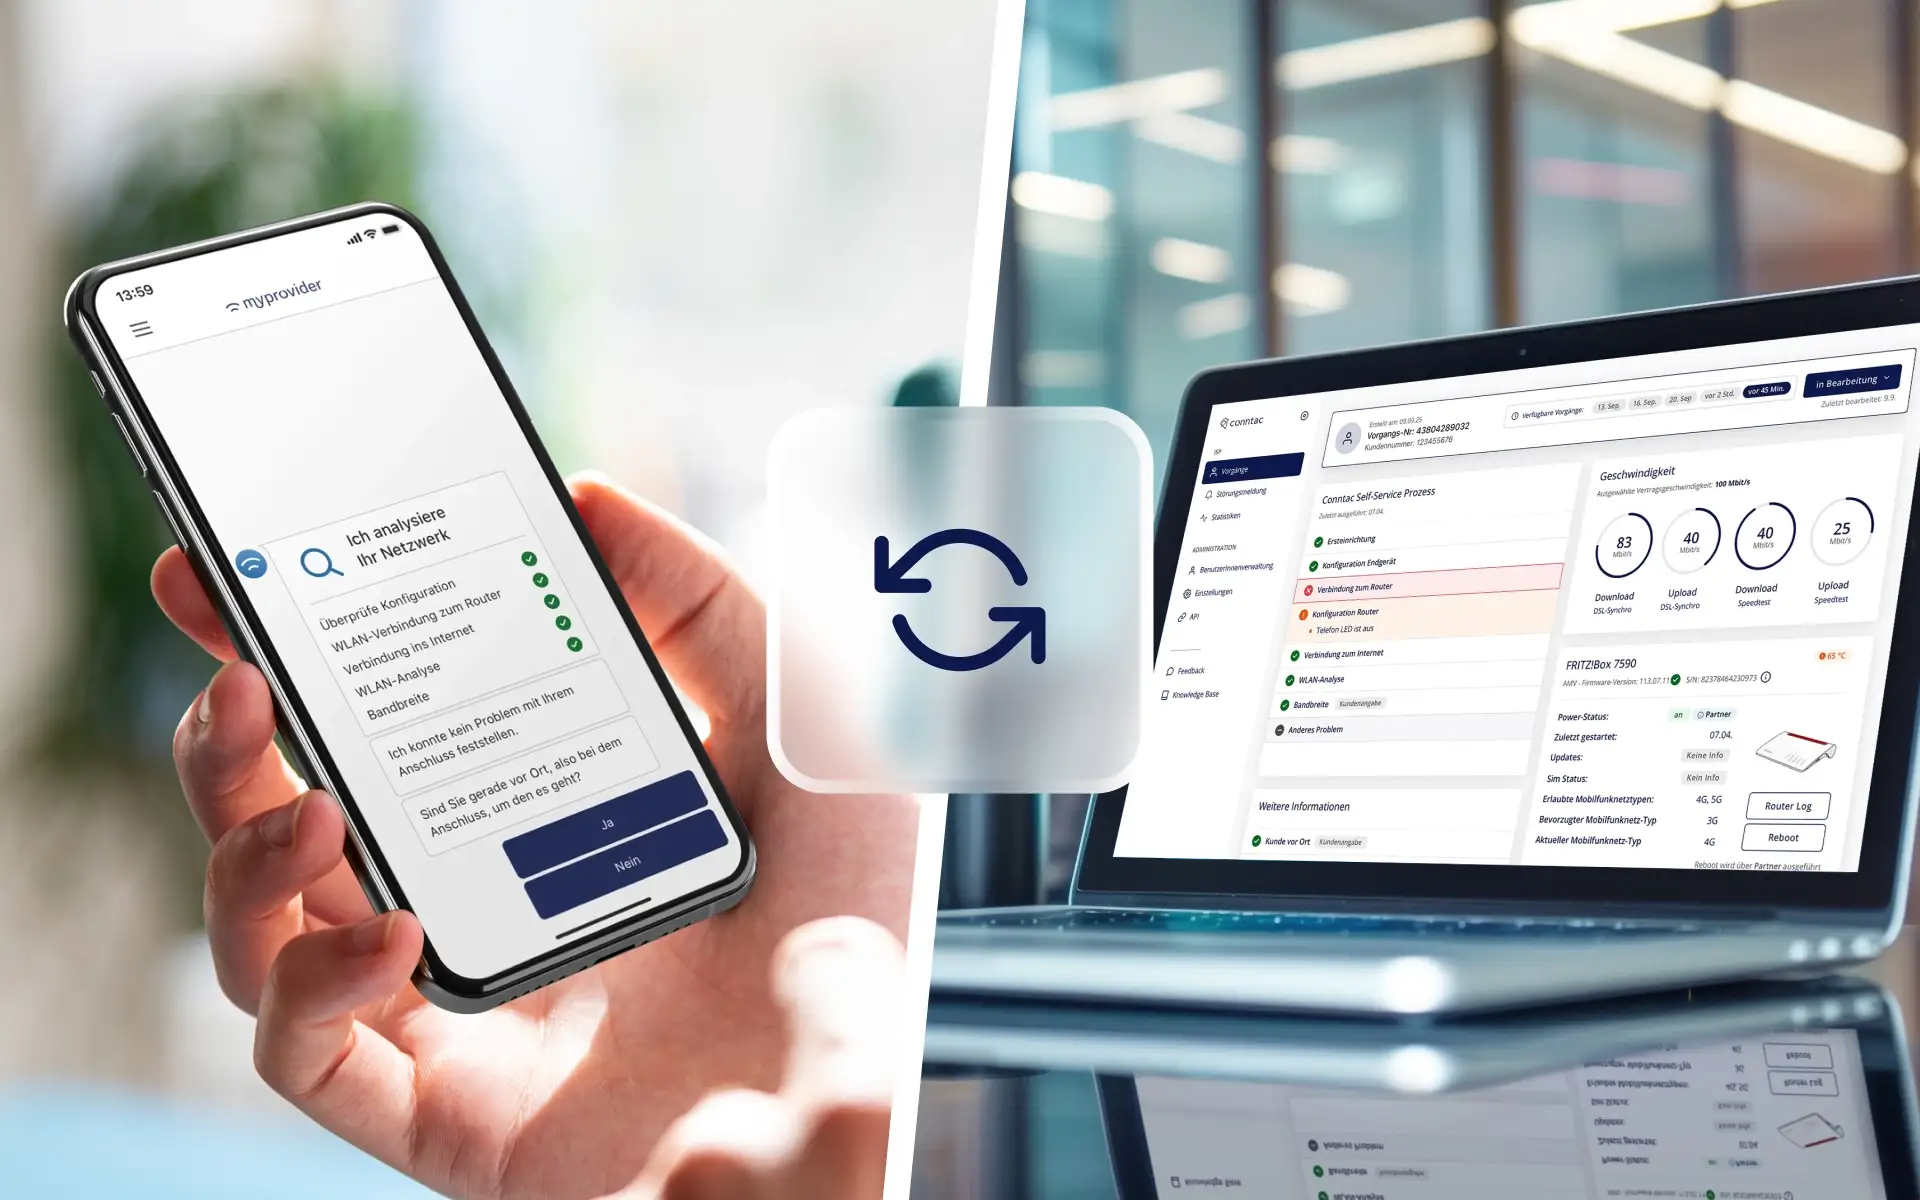
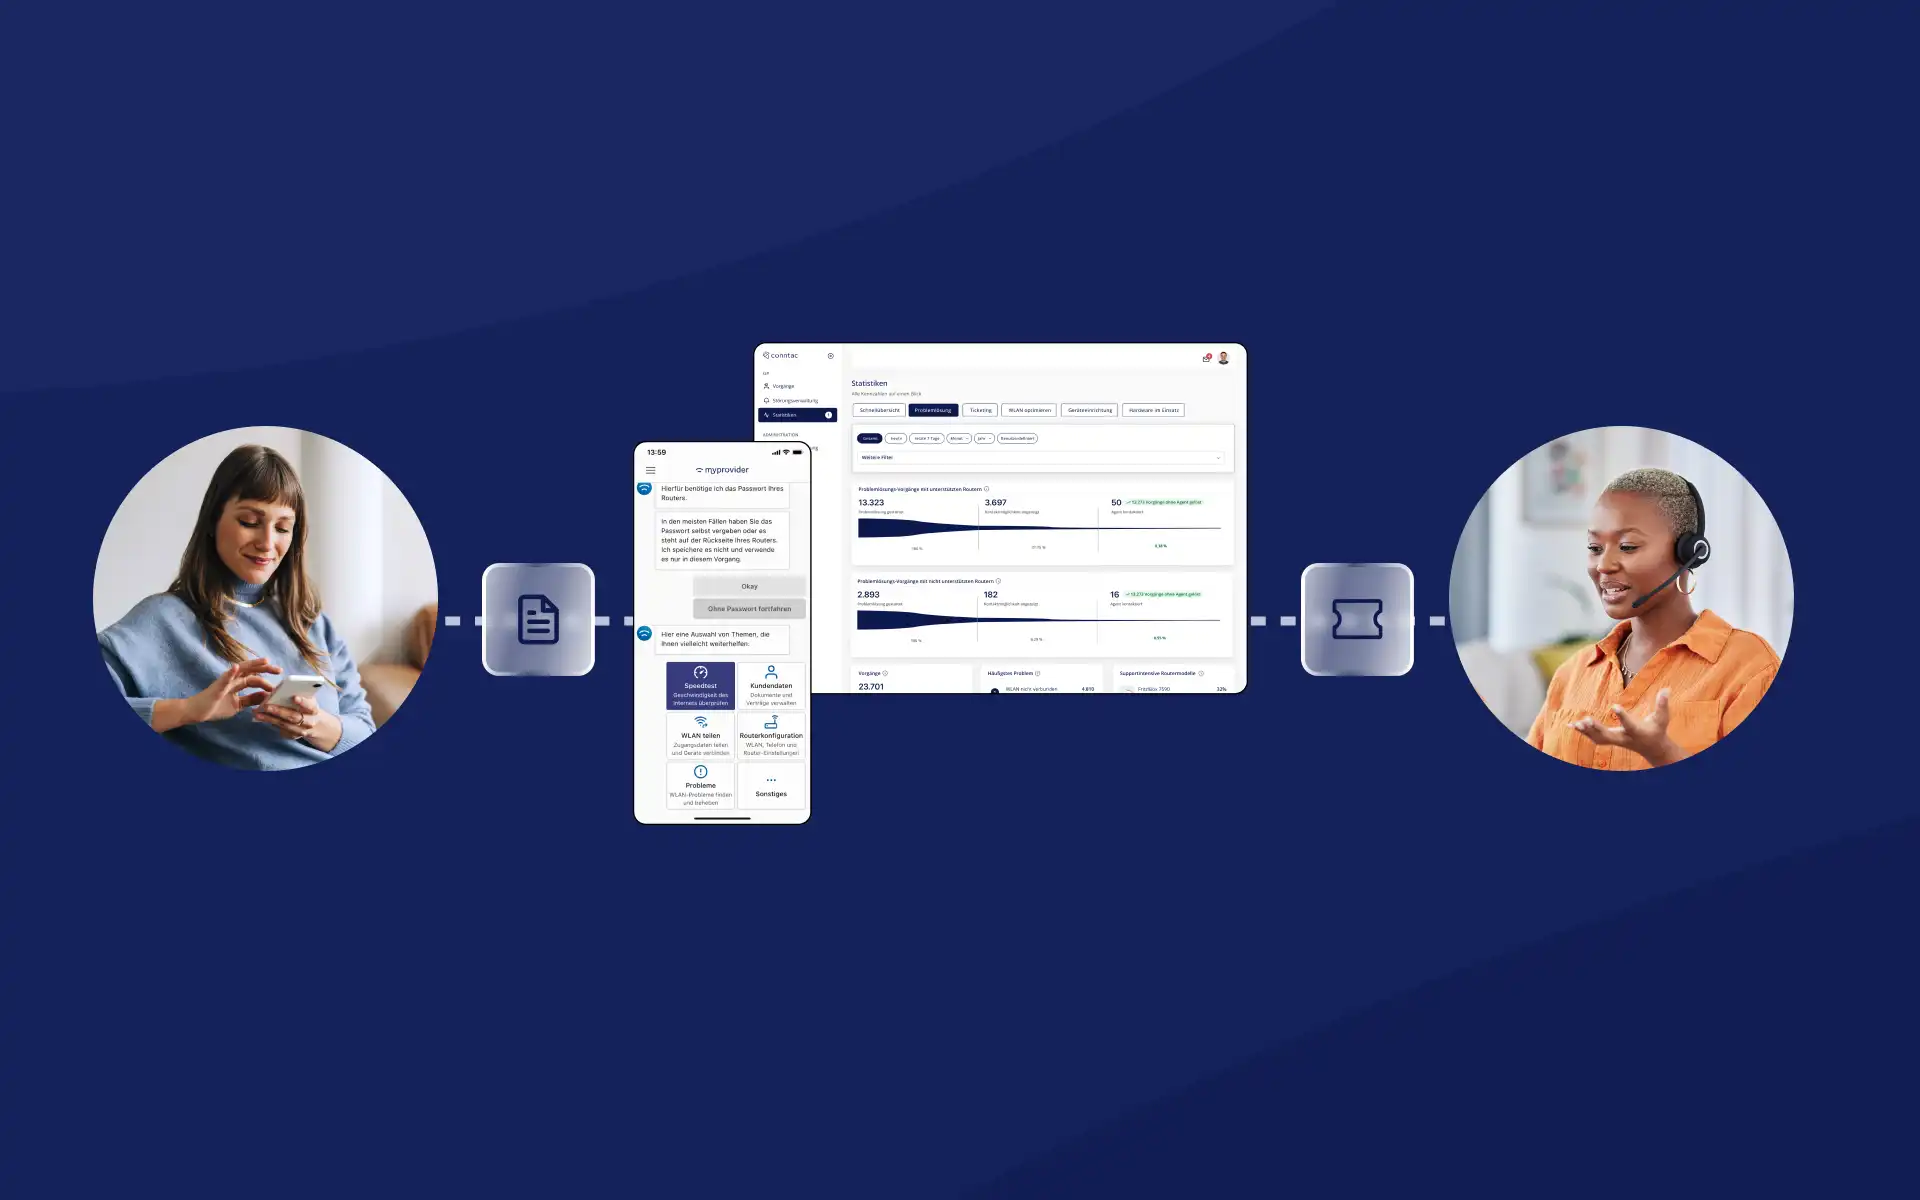
As soon as you compare multiple processes, time periods, or user groups, manual analysis quickly becomes confusing. A dashboard creates a common foundation for centrally evaluating metrics such as usage, process development, and selected service indicators. This makes it easier to identify changes following a release or process optimization and to compare them over time. The Conntac Dashboard supports service and management teams in structured evaluation of digital self-service information and targeted process development.
FAQ: Measuring self-service success
Which KPIs are particularly important for self-service?
The most important self-service KPIs include usage, completion and resolution rates, abandonment rates, handovers, repeat contacts, handling time, and customer effort. Which metrics are most relevant depends on the specific service process.
What is a good self-service resolution rate?
There is no universal target rate. A simple information process has different requirements than a complex technical diagnosis. It is therefore more meaningful to look at the development of the resolution rate within a clearly defined process and time frame.
How do I know if self-service is actually reducing the support burden?
Reduced burden is evidenced by factors such as fewer avoidable contacts, fewer repeat contacts, or shorter handling times after a handover. These metrics should be combined with resolution and abandonment rates.
How often should self-service KPIs be evaluated?
Operational anomalies can be monitored on an ongoing basis. When evaluating process changes, it is useful to look at longer, comparable periods so that individual disruptions or short-term fluctuations do not distort the results.
Conclusion: Self-service success is evident throughout the entire service journey
Measuring self-service after go-live involves more than just tracking usage numbers. For internet service providers, it is crucial to understand how a request evolves: Is the digital process being adopted? Do customers reach a solution? Where do drop-offs occur? How well do handovers work? And is the problem actually resolved for good? Usage, resolution rates, abandonment rates, repeat contacts, processing time, and customer effort combine to create a much more reliable picture of service quality. This turns measurement into the foundation for continuous optimization.
The Conntac dashboard provides transparency into digital service processes and helps to evaluate developments in a structured way.
Discover the Conntac dashboard or schedule a personal demo
Sources
- Qualtrics: Customer Effort Score – Definition and Analysis – for classifying the CES as a metric for perceived customer effort.
- Salesforce: Customer Self-Service – for classifying service metrics such as resolution, ticket volume, and customer satisfaction.